Measuring the overlap of Delaunay tessellations
Looking at the data
Download the HDF5 data file here. The layout of this file can be read using h5tree:
>>> h5tree -va trajectory_two_species.h5
trajectory_two_species.h5  (2 objects)
├── idx  (45,), int64
└── pos  (15000, 91, 2), float64
The pos array has the \((x,y)\) coordinates of 91 particles across 15,000 frames.
The idx array contains integer labels for particles of species 1, of which there are 45.
The remaining 46 particles belong to species 2.
Here are snapshots of the particle positions for different frames, where particle species 1 are the blue particles and particle species 2 are the red particles
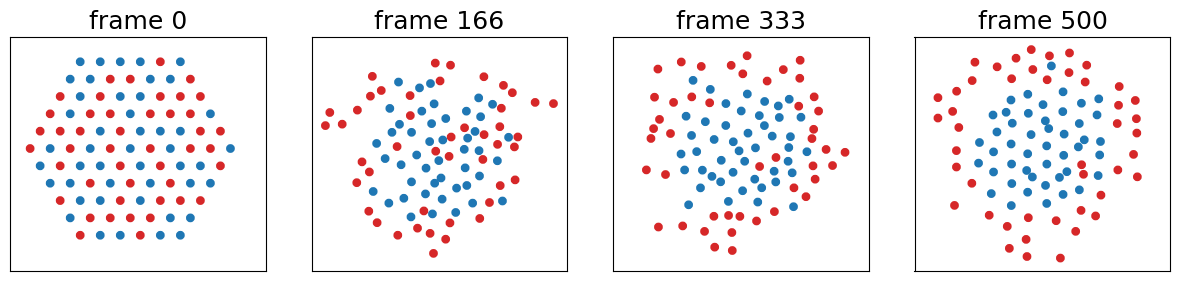
The particle array is initialized to an ordered array where the two species of particles are randomly initialized and mixed together. The array is driven such that, over time, the red particles move to the outside of the array and the blue particles stay towards the center of the array.
Problem statement
We would like to measure how much the two particle species are overlapping in a given frame. An overlap parameter plotted vs. time for the given data should show a decline as the transition from disorder to order occurs.
Constructing truncated Delaunay tessellations for the 2 particle species
A Delaunay tessellation can be carried out for a set of points using scipy.spatial.Delaunay.
Let’s construct the Delaunay tessellation separately for red and blue particles in the last frame and plot them on top of each other

This isn’t too useful since the red tessellation overlaps fully with the blue tessellation. We can amend this by using a truncation distance, i.e. discarding triangles that have an edge length exceeding some distance. Here’s the same tessellations using a truncation distance of \(1.8\times 10^{-6}\)

We can now clearly see that the two tessellations are completely separated, and their overlap area is zero. Let’s look at the same plot for frame 200

In this frame, we do have overlap between the two tessellations. We would like to calculate the area of this overlap region.
Measuring the area of overlap between two tessellations
Finding the intersection of two triangles
To find the area overlap of two tessellations, we need to be able to calculate the intersection of two triangles.
This is an example of clipping, and the Clipper library can be used to do it.
A Python wrapper, PyClipper, also exists.
If pts_1 and pts_2 are the 3x2 arrays of the vertices of two triangles, PyClipper can find the vertices of the intersecting polygon
pc = pyclipper.Pyclipper()
pts_1 = pyclipper.scale_to_clipper(pts_1)
pts_2 = pyclipper.scale_to_clipper(pts_2)
pc.AddPath(list(pts_1), pyclipper.PT_CLIP, True)
pc.AddPaths([list(pts_2)], pyclipper.PT_SUBJECT, True)
intersect = pc.Execute(pyclipper.CT_INTERSECTION, pyclipper.PFT_EVENODD, pyclipper.PFT_EVENODD)

if intersect:
    pts_i = np.asarray(pyclipper.scale_from_clipper(intersect)[0])
The calls to scale_to_clipper and scale_from_clipper are needed since the Clipper library operates on integers.
If the triangles do not intersect, intersect is an empty list, otherwise it is a list where the first item is a Nx2 array of the intersecting polygon vertices.
As an example, here is the algorithm applied to two intersecting triangles, where the intersecting region is a polygon with 5 vertices

The area of a polygon
Given the vertices of the polygon from the clipping algorithm, \((x_i, y_i)\), the area of the Polygon is given by the shoelace formula
\[A = \frac{1}{2} \left| \sum_{i=1}^{N}x_i y_{i+1} - x_{i+1} y_{i} \right|\]In code,
def polygon_area(x, y):
    return 0.5*abs(x.dot(np.roll(y,1)) - y.dot(np.roll(x,1)))
The solution
The overlap area between two Delaunay tessellations can be calculated using the following steps:
- Sum over all pairs of triangles, \(T_i\) and \(T_j\), belonging to each tessellation
- For each pair, use the clipping algorithm to compute their intersection polygon, \(T_i \cap T_j\)
- Calculate the area of the polygon using the shoelace formula
- The toal overlap area is the sum of the areas for all possible intersections
This algorithm is shown applied to frame 200, where the overlap area is shaded in green

Final results
By applying this precedure to every frame in the dataset, we can plot the area of overlap between the two particles species as a function of time

Sure enough, the area overlap starts high and quickly approaches zero.
References
- Area of a polygon, https://en.wikipedia.org/wiki/Polygon#Area
- Clipper, http://www.angusj.com/delphi/clipper.php
- PyClipper, https://pypi.org/project/pyclipper/
- Scipy Delaunay algorithm